Another fun prompt for visualizing interesting stats and data points with GPT
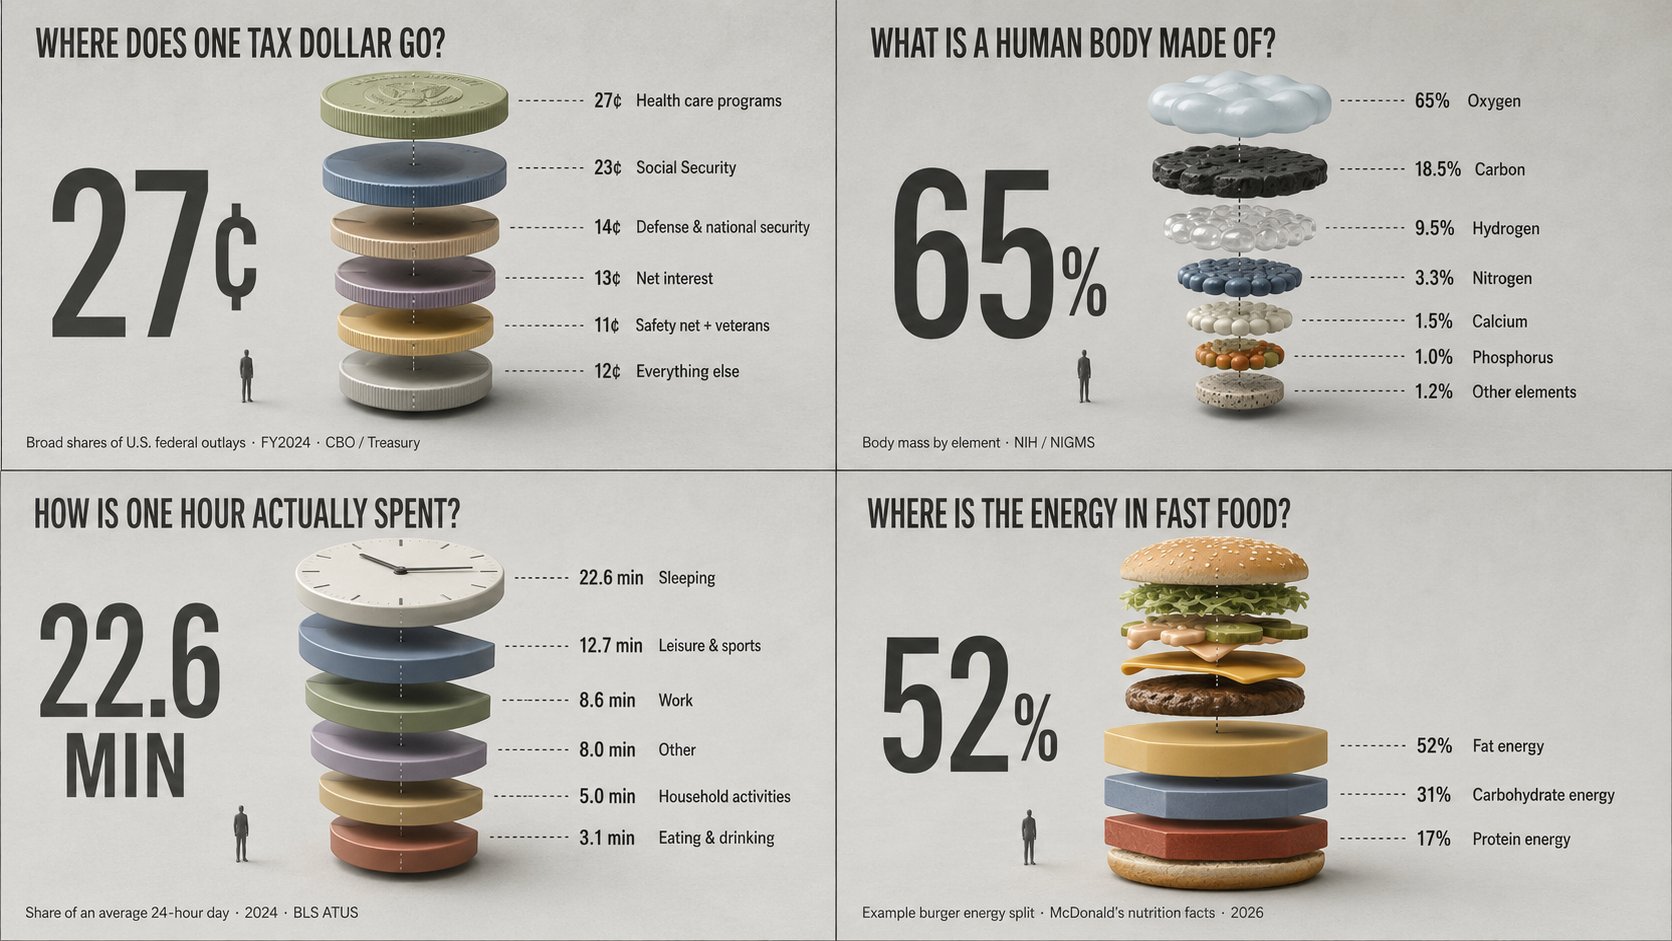
Another fun prompt for visualizing interesting stats and data points with GPT Image 2.\n16:9, 2x2 grid, (topics: where one tax dollar goes · what a human body is made of · how one hour is actually spent · the energy in popular fast foods) A clean exploded-view diagram in the style of an engineering assembly drawing or patent illustration, turning [a \"what is this actually made of / where does it go\" statistic] into floating components — a single whole (one tax dollar, one human body, one hour, one calorie of food energy) blown apart into its constituent fractions, each rendered as a matte clay block sized to its true proportion and suspended along a vertical dotted assembly axis, largest at the bottom. Soft studio lighting, gentle ambient occlusion, concrete-grey backdrop. Thin dashed leader lines and dimension callouts label each floating part in clean grotesque type; one oversized hand-set numeral states the largest fraction; caption with metric and source year. A tiny human silhouette gives scale. Generous negative space between the floating parts. The spirit: a patent diagram for something everyone owns but no one has ever seen taken apart.